One day, a scheduled task running on a 1C1G small instance failed to execute. Checking the logs revealed an OOM error.
I previously wrote about a quick combination of Java dump tricks, but that focused more on issues like deadlocks. This article focuses on memory OOM issues.
The log is as follows:
1 | 2025-01-10 11:55:01.155 INFO 7036 --- [ol-224-thread-1] c.p.bs.service.impl.ScheduleServiceImpl : fetchAndSaveStockFundFlow schedule job start |
The code at the time was written in a brute-force manner: the thread pool was unnamed, all relevant data was retrieved all at once, remote services were called to fetch data, and then everything was dumped into the database in one go.
Therefore, you could guess with your eyes closed that a small 1G instance is allocated only around 300MB of heap memory by default. Coupled with 5 threads configured to operate simultaneously for each task, OOM was only a matter of time even without a memory leak.
DUMP
The first step is to dump the memory snapshot, which is generally done using jmap or jhsdb.
1 | jmap -dump:live,format=b,file=heapDump.hprof [PID] |
1 | jhsdb jmap --binaryheap --pid [PID] |
Although other bloggers recommended using jhsdb, running it resulted in an OOM as well—a true nesting doll scenario.
After executing jmap, the heapDump.hprof file was generated in the execution directory.
Next, you need to find a way to export the file from the server. There are many methods, and scp works fine.
1 | scp username@servername:/remote_path/filename ~/local_destination |
You can also set up a file server using Nginx, which makes it convenient to download other data at any time. (Note data security issues: do not store sensitive data in the directory, as memory dumps can also expose sensitive data.)
Setting Up an Nginx File Server
First, install Nginx
1 | yum install nginx |
Create the public directory used by the file server
1 | mkdir -p /var/www/ |
Note: Please do not create the server directory under the /root folder, as it will cause a 403 Permission Denied error.
Example error:
1 | 2025/01/10 15:25:15 [error] 30497#30497: *18 "/root/fileroot/index.html" is forbidden (13: Permission denied), client: IP, server: , request: "GET / HTTP/1.1", host: "IP" |
Modify permissions and owner. Since the default user is root, sudo is omitted here.
1 | # 修改权限和所有者 |
Create Nginx configuration: /etc/nginx/conf.d/file.conf
1 | server { |
Start the service
1 | systemctl start nginx |
Move the dump result from the first step to the /var/www directory. Open your browser and enter the IP address to view the contents of the folder.
If it is a one-time server, simply use systemctl stop nginx to stop Nginx after downloading.
Analysis
There are many analysis tools, but IntelliJ IDEA can directly open and analyze hprof files.
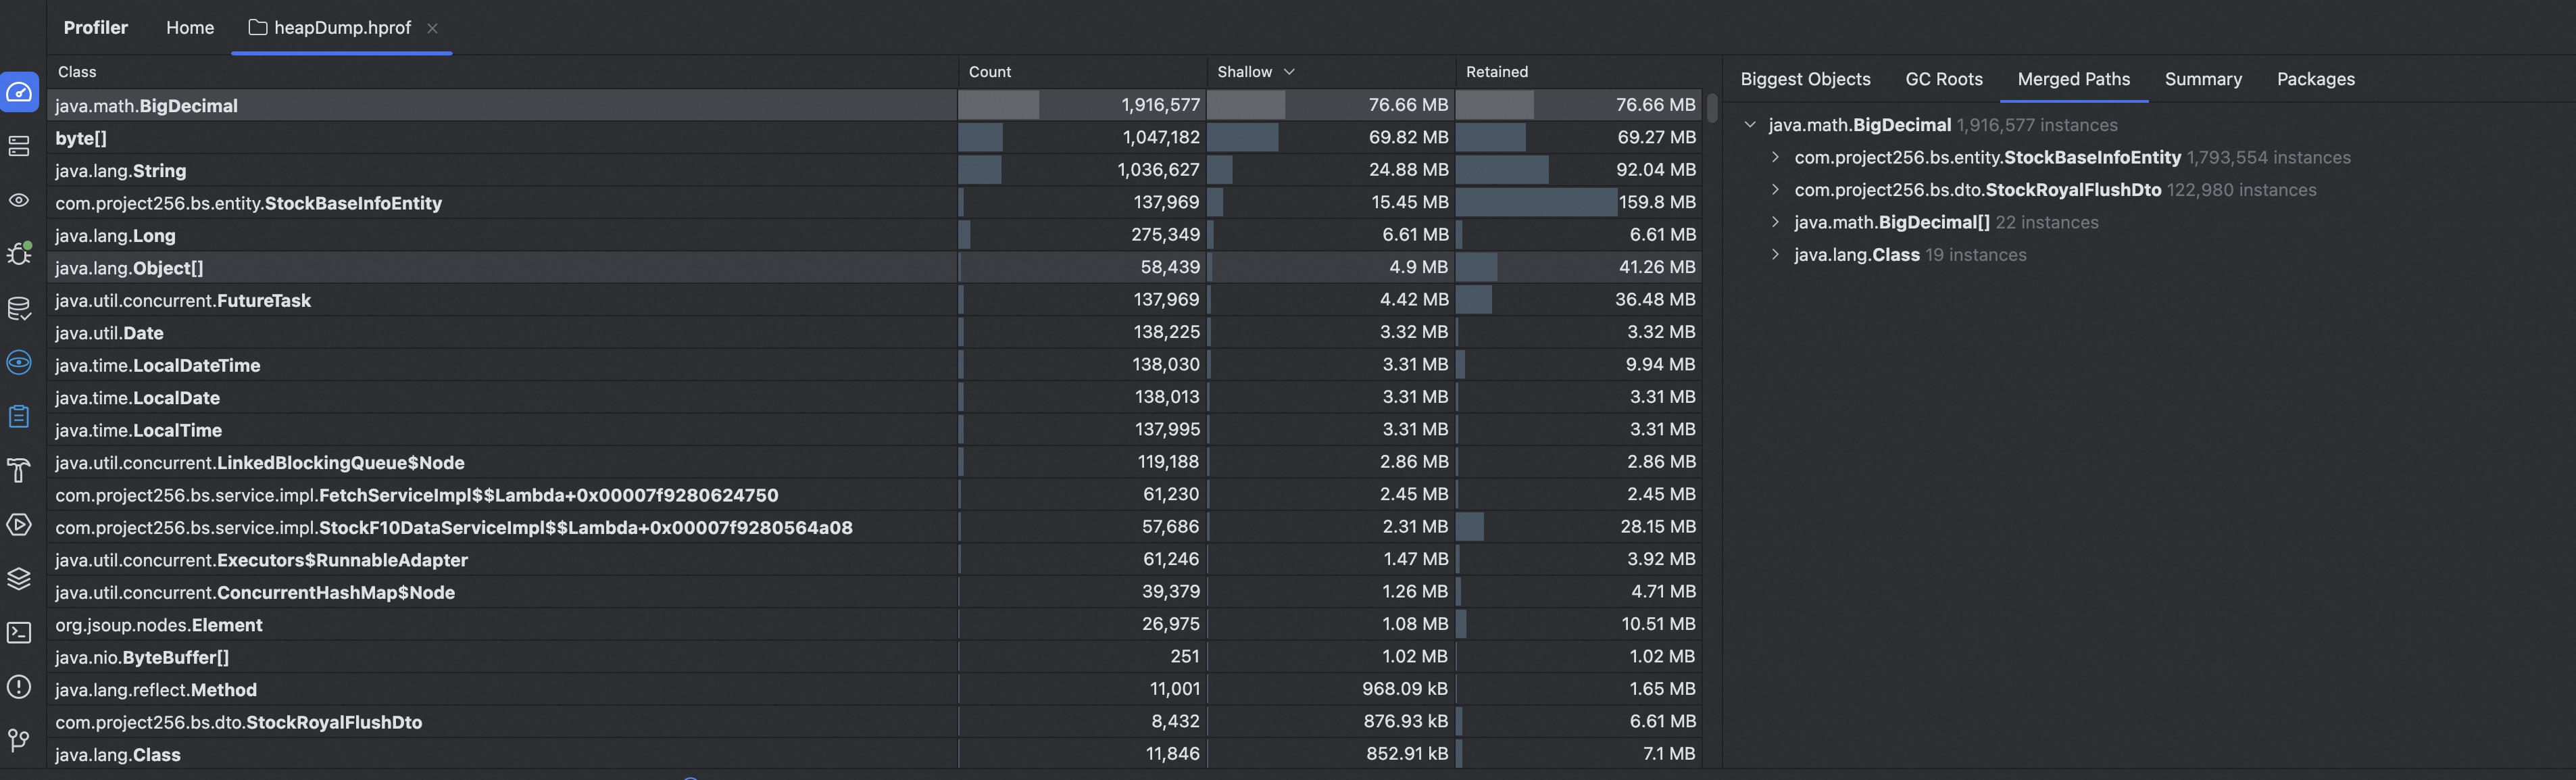
You can see which DTOs have a high count. Obviously, the problem stems from repeatedly “retrieving all relevant data at once”, which generated too many StockBaseInfoEntity instances, occupying 159.8MB. As mentioned above, Java’s default maximum heap memory is 25% of the machine’s memory, making it very easy to hit an OOM.
Code Optimization
Staticizing Common Data
Since multiple tasks require the same common data, and the original code repeatedly fetched the common data in full, the memory continuously bloated.
Therefore, staticizing common data allows multiple read operations to point to the same memory location.
However, keep in mind: 1. Data needs to be initialized during project cold startup, and 2. Thread safety concerns.
Batch Partitioning
Change querying all, processing all, and writing all to operating in batches of 1,000 or 100 records at a time.
You can partition directly using Guava. To avoid adding new dependencies here, native for loops are used:
1 | for (int i = 0; i < stockBaseInfoEntities.size(); i += Base.BATCH_SIZE) { |
Naming the Thread Pool
Here, Hutool’s NamedThreadFactory class was used directly.
1 | private final ExecutorService instructExecutorService = Executors.newFixedThreadPool(BsInstruct.THREAD_NUM, new NamedThreadFactory("InstructExecutor", false)); |
Modifying JAR Runtime Parameters
Adjusting the heap size:
1 | java -Xms128m -Xmx750m -jar yourapp.jar |
Adding GC-related parameters:
1 | java -Xms128m -Xmx750m -XX:+PrintGCDetails -jar yourapp.jar |
After Optimization
338MB → 59.6MB

Appendix: Java Extra Options
Running java -X allows you to view all extra options and their explanations.
1 | java -X |
GC log options, adapted from https://www.cnblogs.com/dupengpeng/p/17620200.html :
1 | -XX:+PrintGC <==> -verbose:gc 打印简要日志信息 |
Appendix 2: Viewing Heap Information with jhsdb jmap
1 | jhsdb jmap --pid [PID] --heap |
1 | Attaching to process ID 31724, please wait... |
Appendix 3: Viewing Class Memory Usage with jhsdb jmap histo
Sorted in descending order of memory usage. Note that it will print a large amount of information, so piping to more is recommended.
1 | jhsdb jmap --pid [PID] --histo | more |
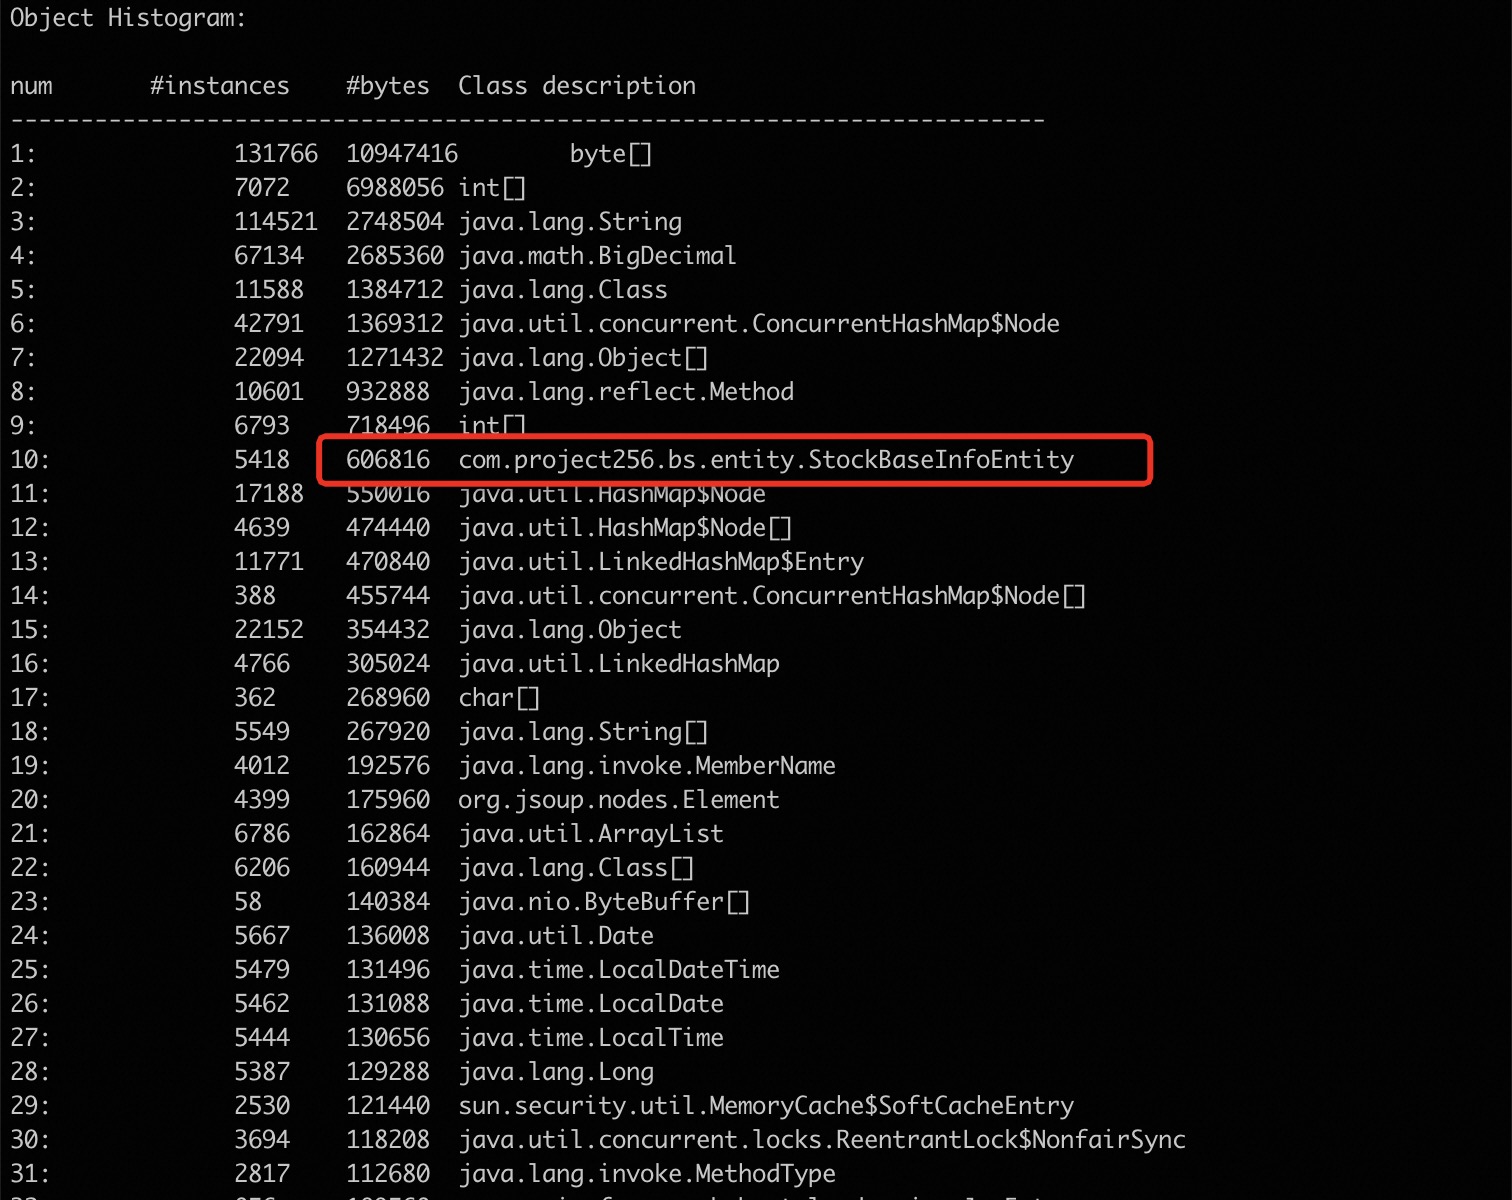
Among the large pile of information above, only one is familiar. This entity is the staticized object mentioned earlier, confirming that the memory leak issue has been resolved.